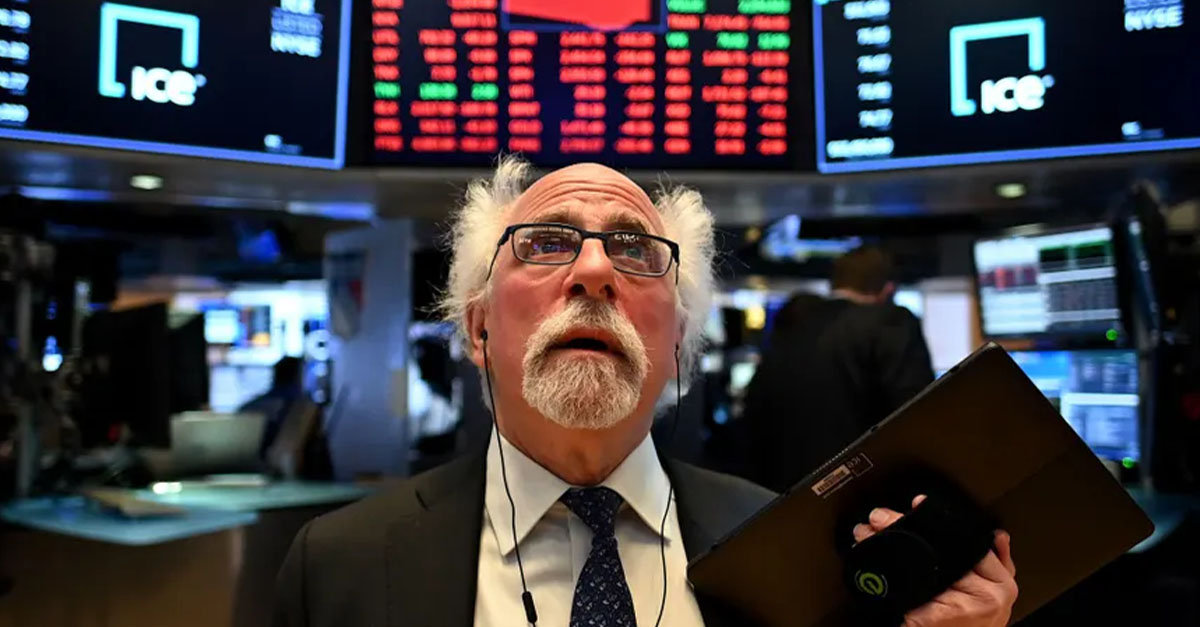
When Markets Crash
A stock market crash is usually defined as a double-digit percentage loss on a major trading index like the Dow Jones Industrial Average (DJIA) or Standard & Poor's 500. While many people have heard of the 1929 Wall Street Crash, many other stock market crashes have disappeared from the public memory. Here, we review history’s biggest stock market crashes. Let’s see how many of these you know!
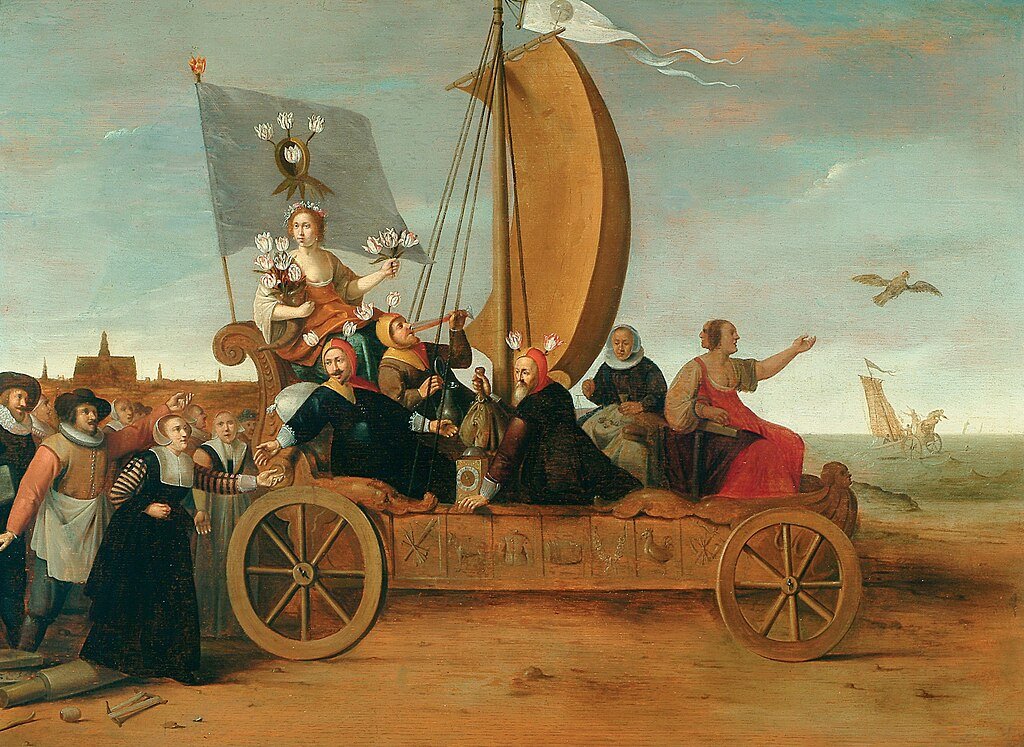
1637: Tulip Mania
The Netherlands in the 1630s saw the first recorded instance of a speculative bubble. With the popularity of tulips at an all-time high, contract prices to buy tulip bulbs rose through the winter of 1636–37. The price of the bulbs eventually collapsed, leaving the contract-holders on the hook to pay 10 times the new price. How big of a crater did this crash make?
 Jean-Léon Gérôme, Wikimedia Commons
Tulip Mania: The Modern View
Though the crash in the tulip market was viewed for centuries as an example of mass delusional buying and herd behavior, the actual effect on the Dutch economy was limited. The government arbitrated contract holders to settle their accounts for a 10% fee. Modern economists still argue about the tulip price bubble, but there’s no denying that the tulip price followed the basic dynamic of a crash.
 Hendrik Gerritsz Pot, Wikimedia Commons
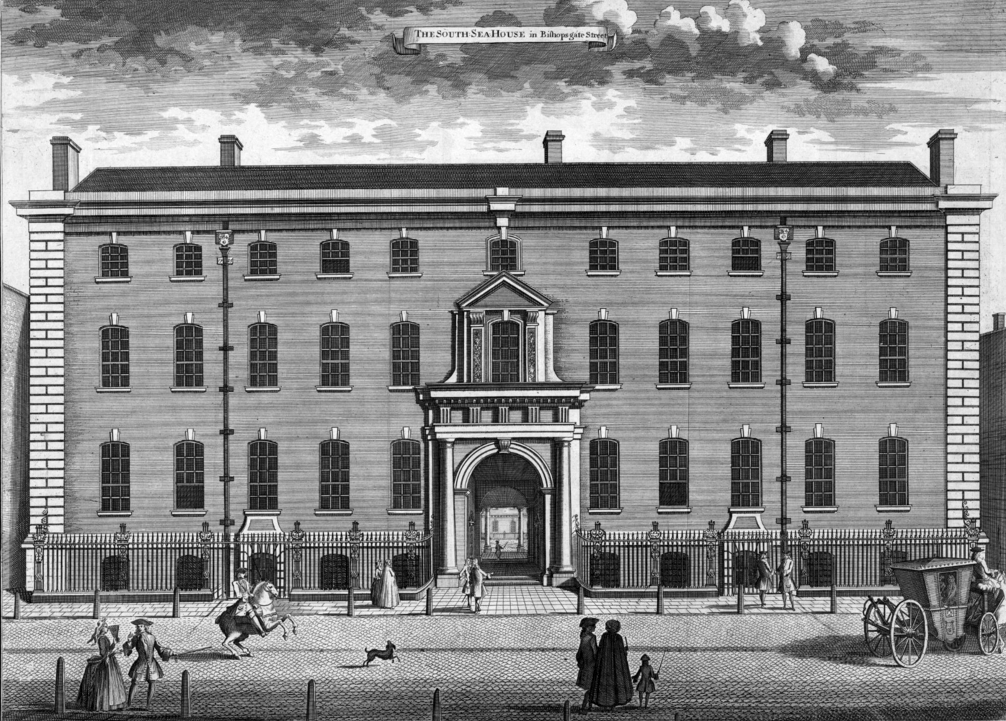
1720: The South Sea Bubble
Share prices in the British South Sea Company shot up as the company gained a monopoly on providing slaves to the Spanish colonies in Latin America. With Britain already in armed conflict with Spain, the company took on a major share of British government debt before the share price collapsed, leaving thousands of investors ruined. Attention quickly turned to the company’s directors.
 Thomas Bowles, Wikimedia Commons
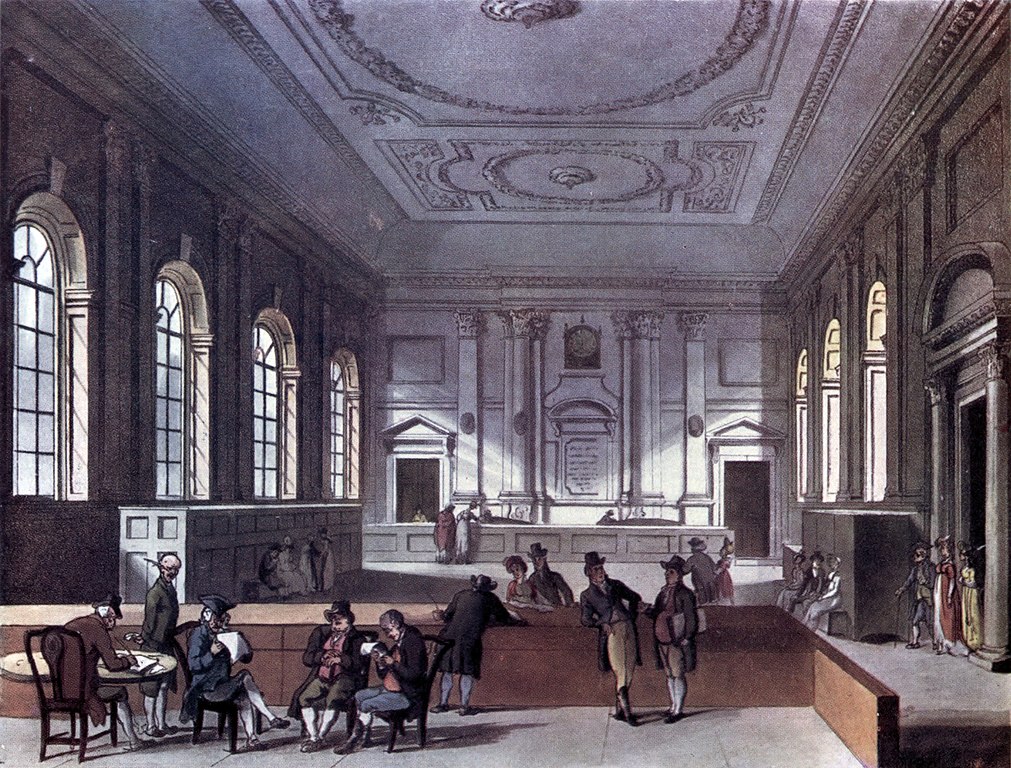
The South Sea Bubble: A Tale As Old As The Hills
The bankrupted investors included some fairly powerful people in Britain. A parliamentary investigation soon discovered evidence of fraud, bribery, and insider trading by South Sea directors. Many of them were stripped of their wealth while the British government implemented its new Bubble Act of 1720 to protect future investors.
 Thomas Rowlandson, Wikimedia Commons
The Panic Of 1792
An attempt by speculators to drive up the price of bank stocks using borrowed money came crashing down in 1792 when the Bank of the United States suddenly tightened credit. When the speculators defaulted on their loans, a run on the banks quickly ensued and the panic was on. Who could untangle such a mess?
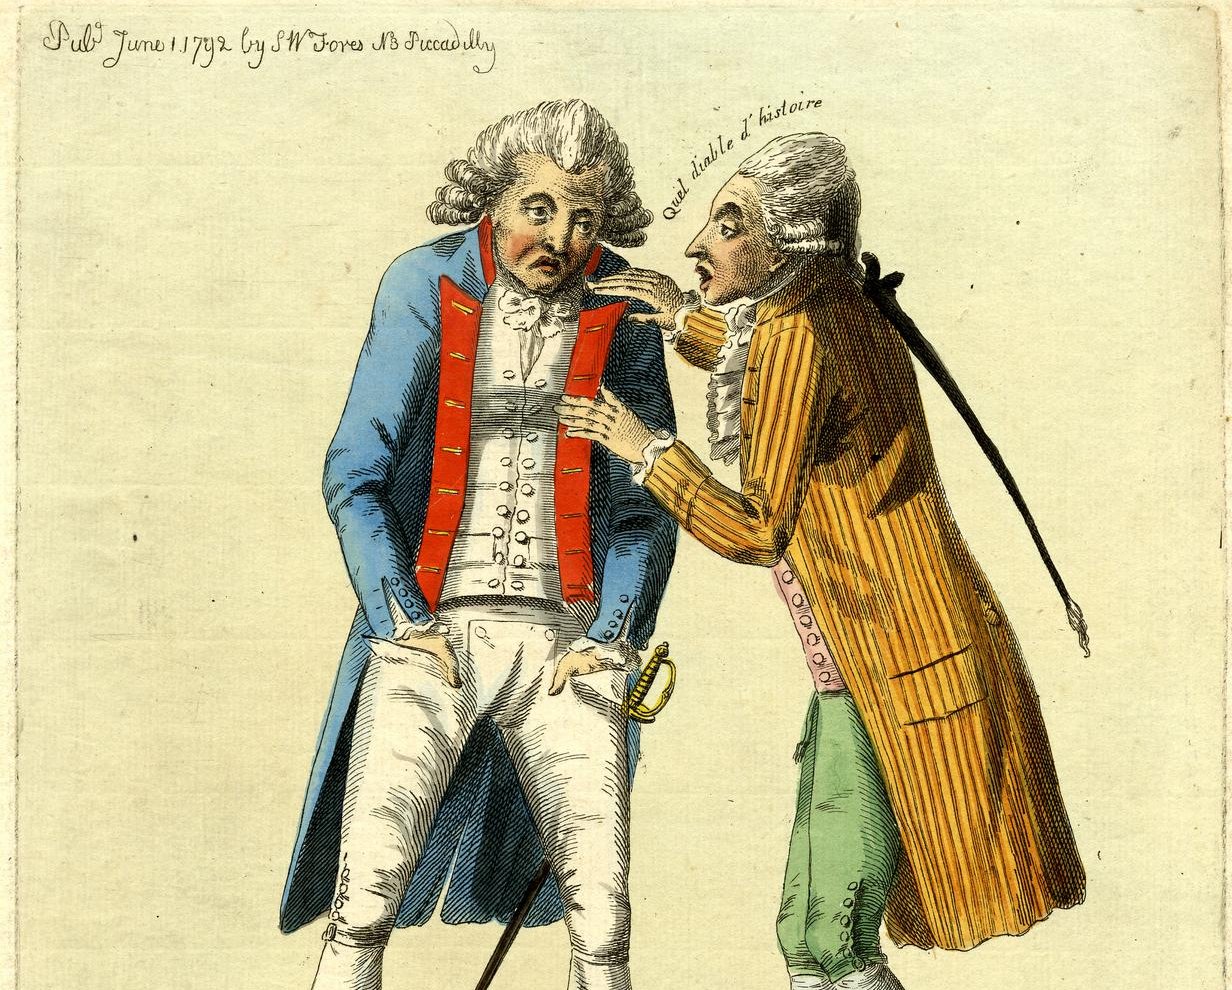 British Museum, Wikimedia Commons
Hamilton Restored Order
US Treasury Secretary Alexander Hamilton quickly implemented a series of measures including: backing further lending by the banks with US government debt as collateral; and direct government buying of public debt. Hamilton’s intervention restored stability to the financial system and became a model for handling future crises.
 John Trumbull, Wikimedia Commons
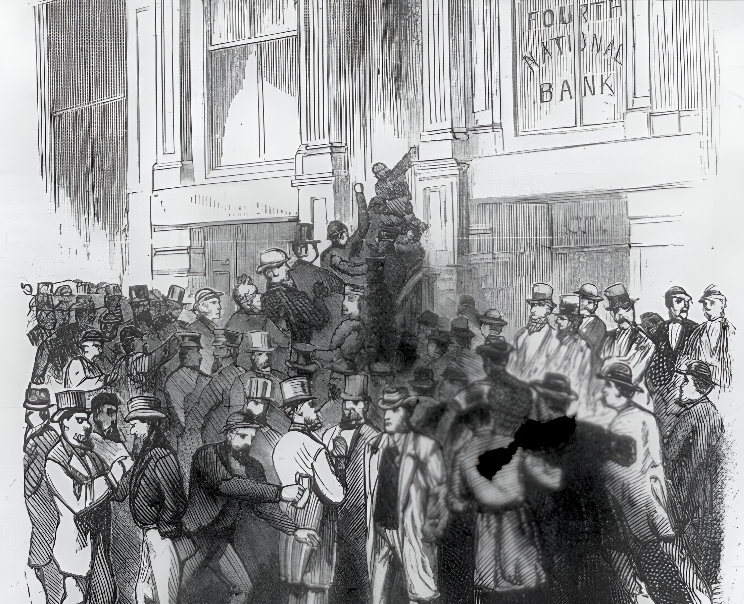
The Panic Of 1873
The 1873 failure of the Jay Cooke & Company bank in New York led several other banks to go belly up. With the banks heavily invested in railroads, a wave of railroad bankruptcies soon followed. Tight credit and inflated share prices also helped trigger the crash of 1873, one of the worst in US history causing a depression that would last to the end of the decade.
 Unknown Artist, Wikimedia Commons
The Long Depression
Before the Great Depression there was the Long Depression. These lost years of the 1870s saw the government unable to implement the necessary reforms to get the economy going again. The incumbent Republican government brought back the gold standard which eventually restored stability to the economy. The southern states were especially hard-hit, voting out Republicans and effectively ending Reconstruction.
 Library of Congress, Wikimedia Commons
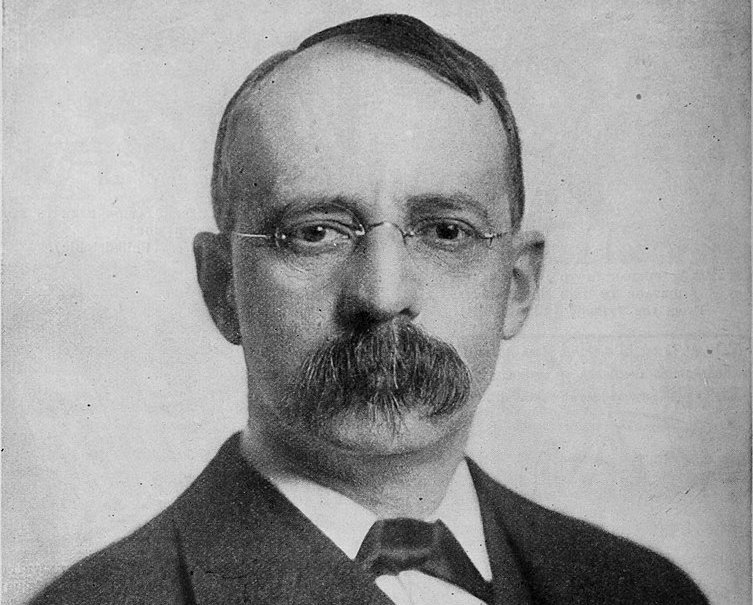
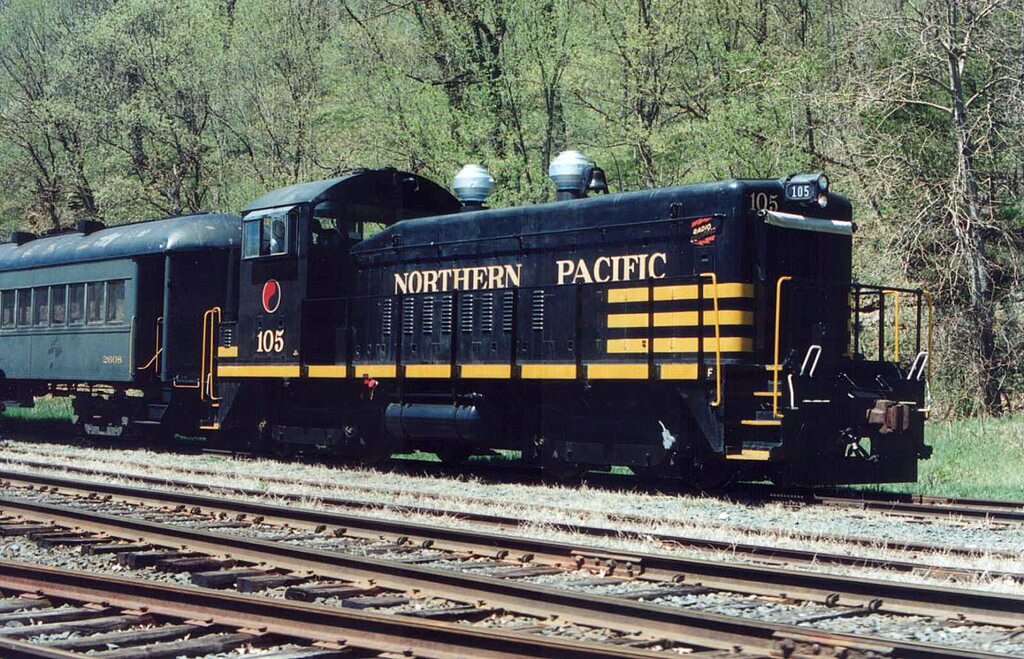
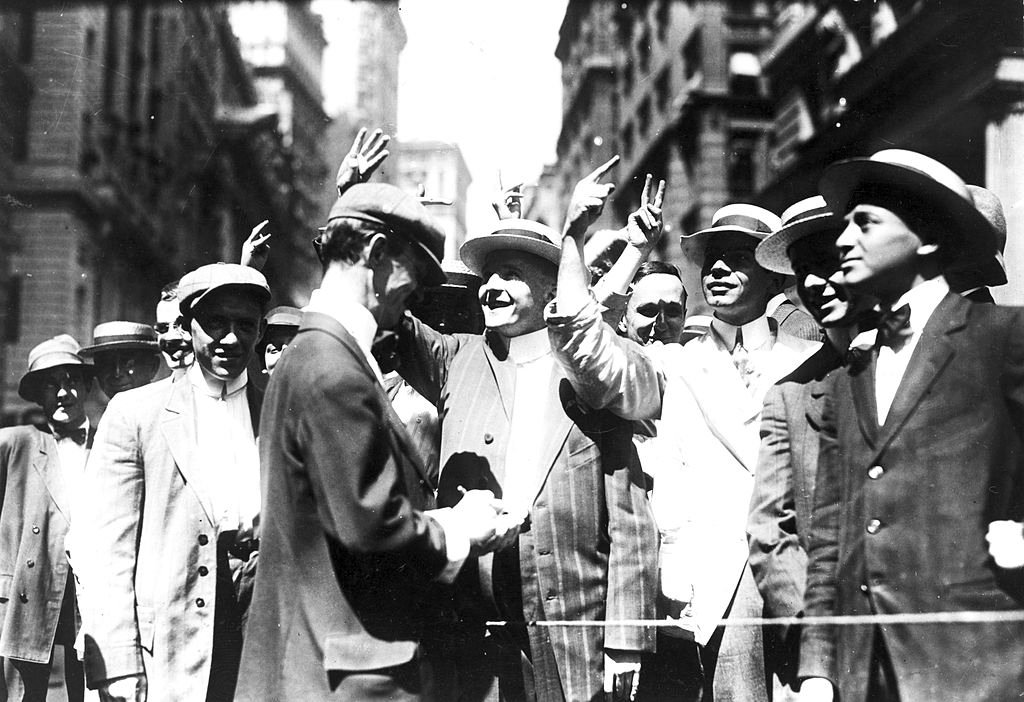
The Panic Of 1901
An attempt by Union Pacific Railway chairman EE Harriman to corner stock in the Northern Pacific Railway led to a sharp downturn in railroad share prices. A panicked sell-off quickly followed that affected several other industries. What caused this sudden crash?
 Unknown Artist, Wikimedia Commons
The Panic Of 1901: Short-Sellers Squeezed
When Northern Pacific’s share price went through the roof, those trying to short-sell Northern Pacific started hemorrhaging money. They sold all the shares they had, setting the crash in motion. Harriman and James J Hill formed a holding company to control Northern Pacific, but their success was short-lived. Their company was ruled a monopoly under antitrust litigation pursued by new president Theodore Roosevelt.
 Lesbardd, CC BY-SA 4.0, Wikimedia Commons
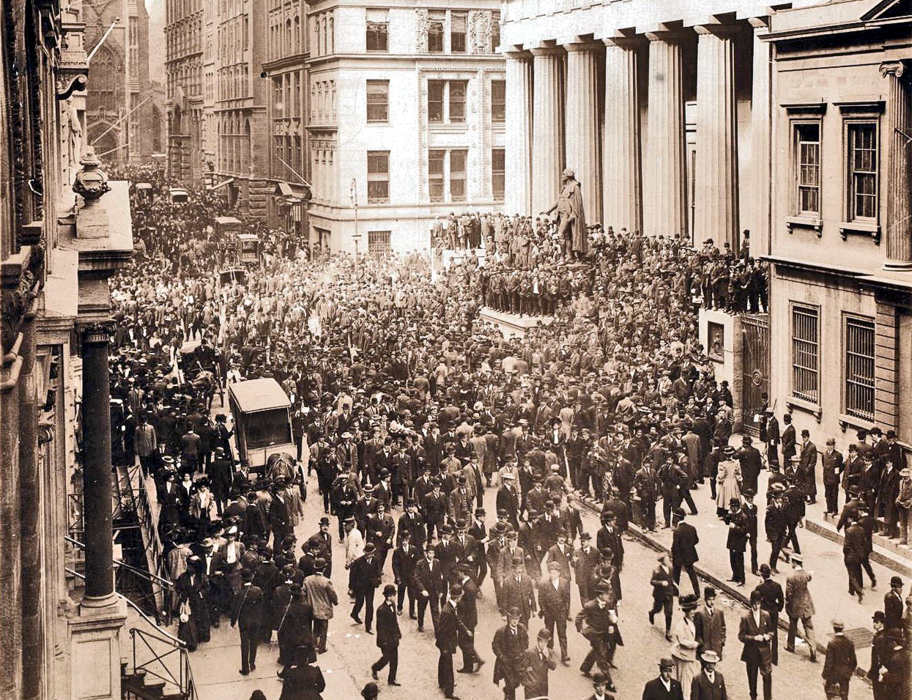
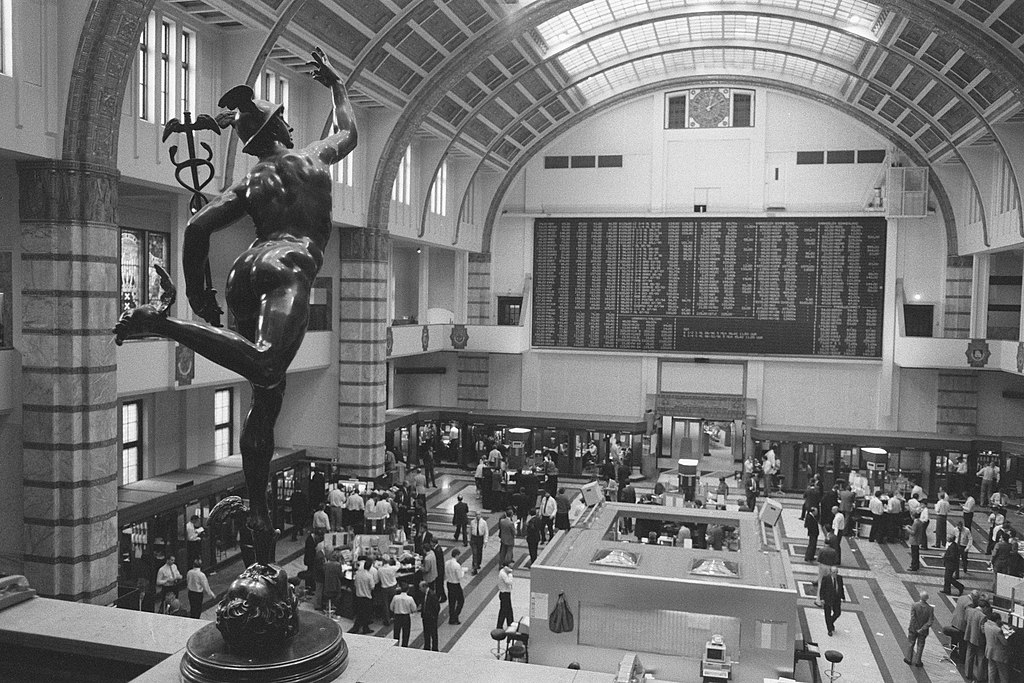
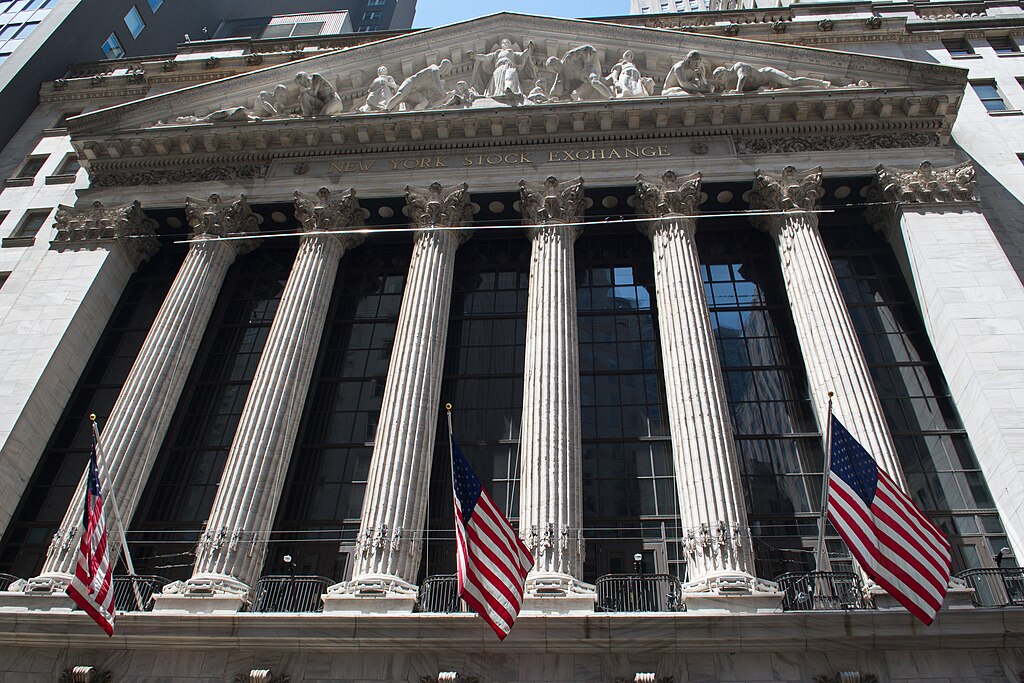
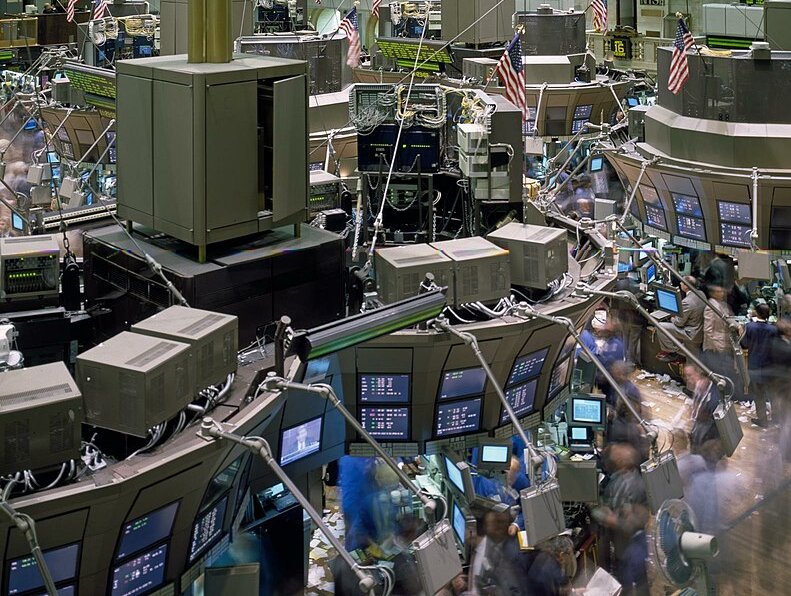
The Panic Of 1907
A failed bid to corner all the shares in United Copper led to a run on the banks that had financed the attempt. The result was a full-blown stock market crisis in an economy already in recession. The New York Stock Exchange lost 50% of its value in three weeks. With stock market crashes and bank runs now a routine occurrence every few years, people wondered if there was a way to break the cycle.
 Soerfm, CC BY-SA 3.0, Wikimedia Commons
The Panic Of 1907: The Beginnings Of The Federal Reserve
With the United States lurching from one financial crisis to another, calls grew for a central bank to bring order to the system. After the 1907 crash, a government commission recommended the establishment of the Federal Reserve, which started operations in 1913.
 George Grantham Bain Collection, Wikimedia Commons
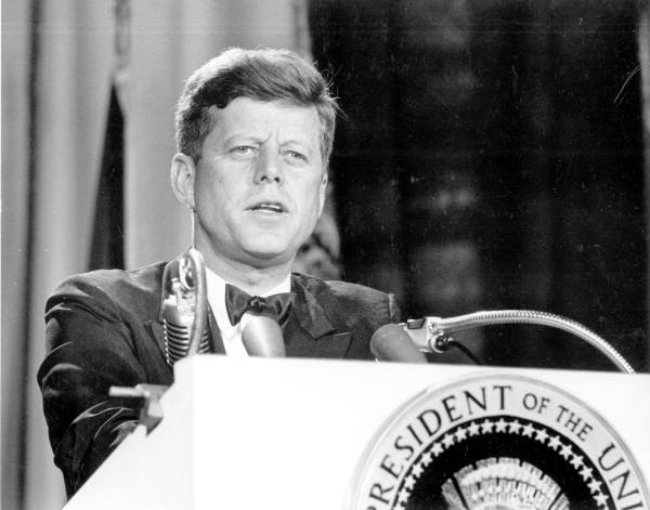
1962: The Kennedy Slide
The 27% drop in stock prices in the first six months of 1962 marked the US economy in what is now known as the Kennedy Slide. The Dow Jones average fell almost 6% in this period—the second-biggest downturn in its history. Though the drop was significant, it was a walk in the park compared to the crashes of decades past. The market resumed an upward course by the end of the year. But what caused the drop in the first place?
 State Library and Archives of Florida, Wikimedia Commons
1962: A Familiar Suspect
Analysts saw echoes of the 1929 crash in the 1962 slide, including an overvalued market and a slowing economy. An SEC investigation found an array of complex causes and interactions for the drop, which it labelled a “non-recurring event”. The market quickly rebounded and the drop has been mostly forgotten.
 Thomas J. O'Halloran, Wikimedia Commons
The 1973–74 Stock Market Crash
This slow-motion two-year crash saw the Dow Jones lose 45% of its value between January 1973 and December 1974. The drop rocked all the world’s major stock markets, but was worst-felt in the UK. Coupled with the oil embargoes of the era, the crash signalled the economic stagnation in the West that would last into the 1980s.
 Dr Neil Clifton, Wikimedia Commons
1973–74: A Long Road Back
There were very few immediate solutions to the bear market that set in in 1974. The UK didn’t see its market return to the same level in real (inflation-adjusted) terms until 1987; the United States didn’t get back to its former mark until 1993!
 White House Photographs, Wikimedia Commons
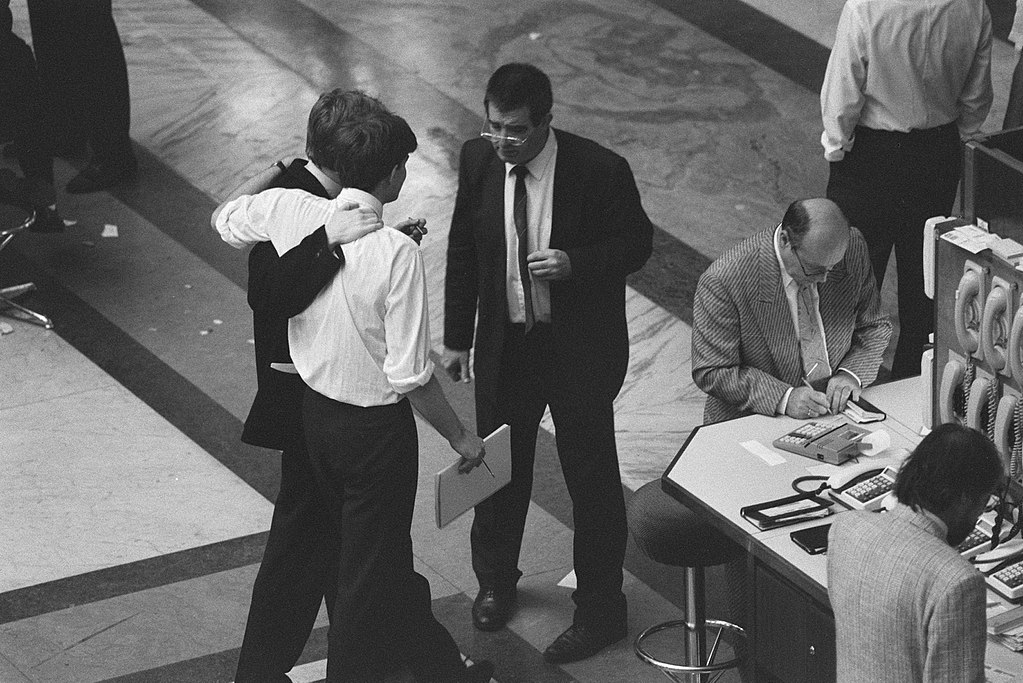
1987: Black Monday
Investors and traders gasped at the losses of October 19, 1987. The Dow Jones fell over 22%, the worst one-day crash in its history. The causes of the drop were: worries about the US dollar; a bearish week leading up to October 19; program- or algorithm-driven trading; and plain old human fear. Though the drop triggered worries about a depression, the market quickly bounced back. But what was the real outcome of Black Monday?
 Bart Molendijk, CC0, Wikimedia Commons
1987: Circuit Breakers
The Black Monday meltdown saw the major stock exchanges put halts on trading when drops reach certain percentages. US exchanges halt trading for 15 minutes when the market drops 7% from yesterday’s close. If the market drops 20%, trading is halted for the rest of the day. The measures have helped markets ride out other crashes in the years since.
 Bart Molendijk, CC0, Wikimedia Commons
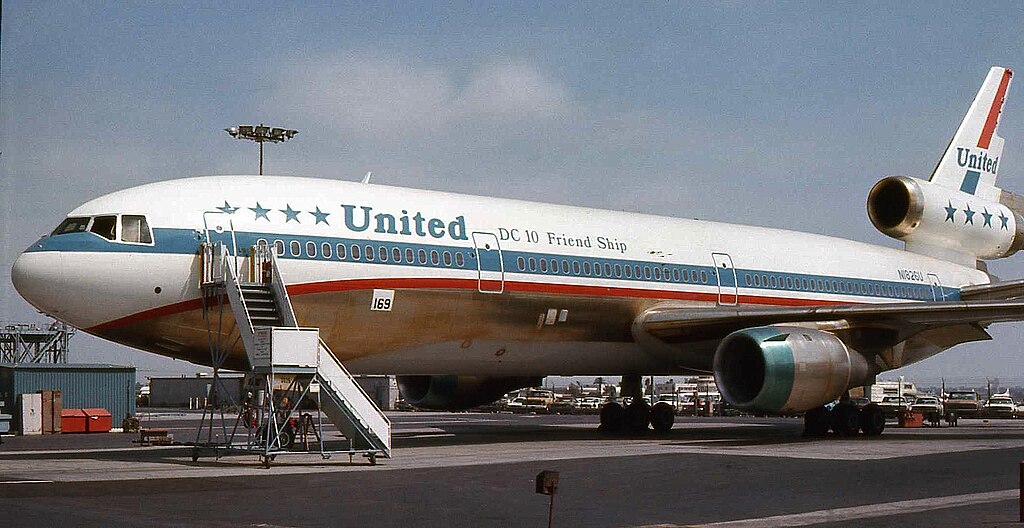
1989: Friday The 13th Mini Crash
The Dow Jones fell almost 7% on October 13, 1989 allegedly on news of a failed leveraged buyout of United Airlines. The markets had hit an all-time high just the previous Monday, and would bounce back up on the following Monday. This crash wasn’t much more than a hiccup. What are we missing here?
 Piergiuliano Chesi, CC BY 3.0, Wikimedia Commons
1989: Leveraged Buyouts Lose Their Luster
United Airlines’ share of the US stock market was a small fraction of 1%, so it hardly makes sense that the failed buyout would have such a big impact. The failed deal possibly caused fear among investors that other buyouts would fall through as well. In any case, the market quickly recovered.
 Charles O'Rear, Wikimedia Commons
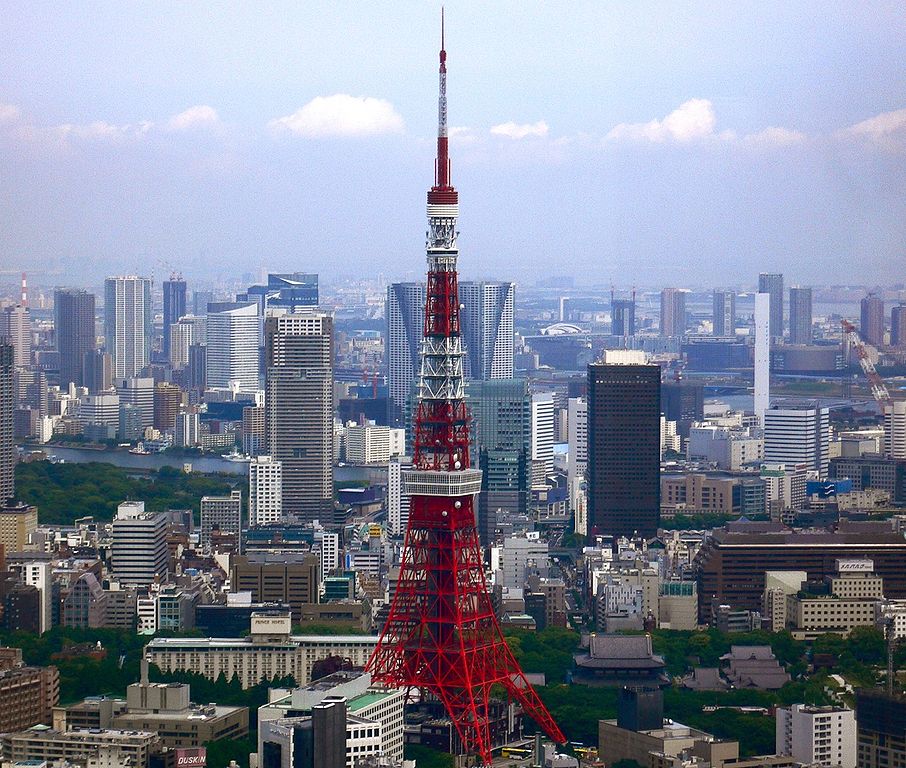
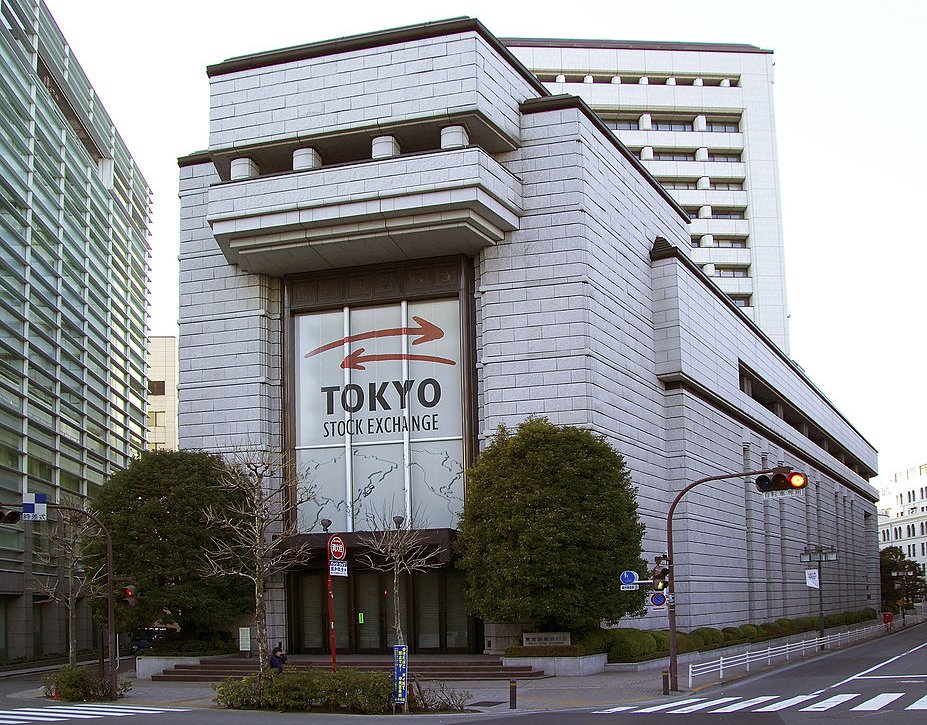
1991: The Japanese Bubble
After reaching a record high in December 1989, the Nikkei (Tokyo) Stock Index fell 43% by December 1990. The market lost a further 30% by August 1992, a huge loss. Widely viewed as the economic powerhouse of the future through the late 1980s, Japan was suddenly spinning its wheels. What caused the Japanese crash?
 Volfgang, CC BY-SA 3.0, Wikimedia Commons
1991–2011: Japan’s Lost Decades
The bursting of the Japanese Asset Bubble led to a 20-year stagnation of the Japanese economy. The causes of the initial bubble in the 1980s are complex, but include: a high yen; over-investment in real estate; poor monetary policy by the Bank of Japan; and unfavorable tax policies.
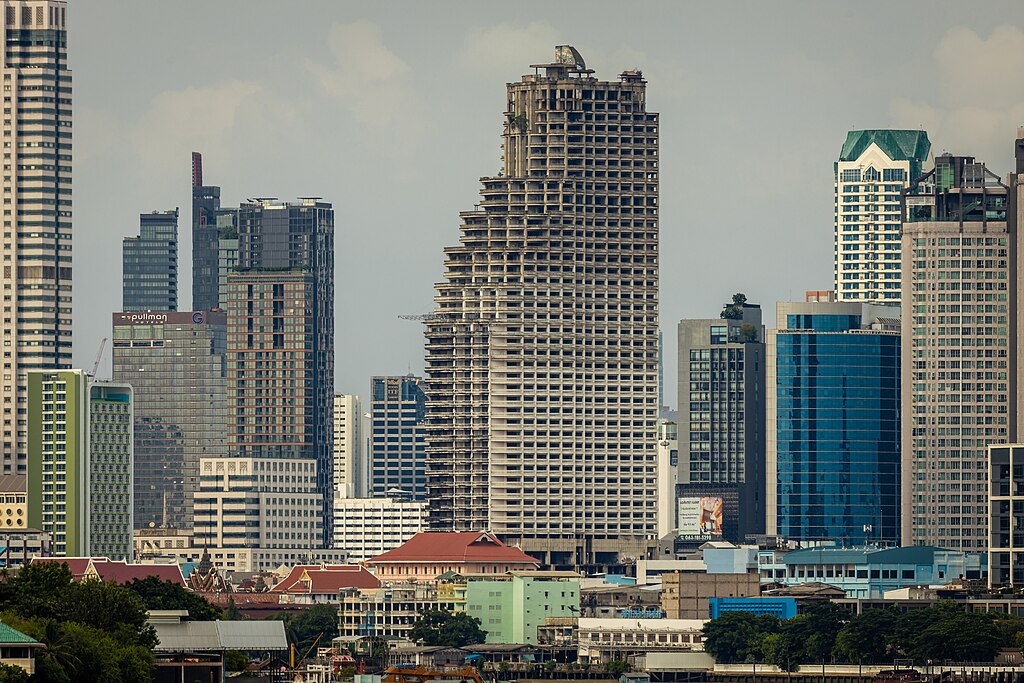
1997: Asian Financial Crisis
The Hang Seng Index of Hong Kong dropped 6% on October 26, 1997, the result of a general financial crisis in Southeast Asia. The Dow Jones also lost close to 7% that day, after undergoing a 30-minute trading halt. International markets quickly rebounded, but for many countries in Asia, the recovery took quite a bit longer.
 Supanut Arunoprayote, Wikimedia Commons
1997: Bubbles Over The Asia-Pacific
The Asia Financial Crisis and stock market crash was the result of credit bubbles in several Asian currencies. Thailand’s currency (the baht) collapsed, causing a general downturn in the region. The slump led to some serious political fallout, including the ouster of the leaders of Indonesia and Thailand. Despite the chaos on the markets, the economy of the region recovered by 1999.
 Office of the Vice President of the Republic of Indonesia, Wikimedia Commons
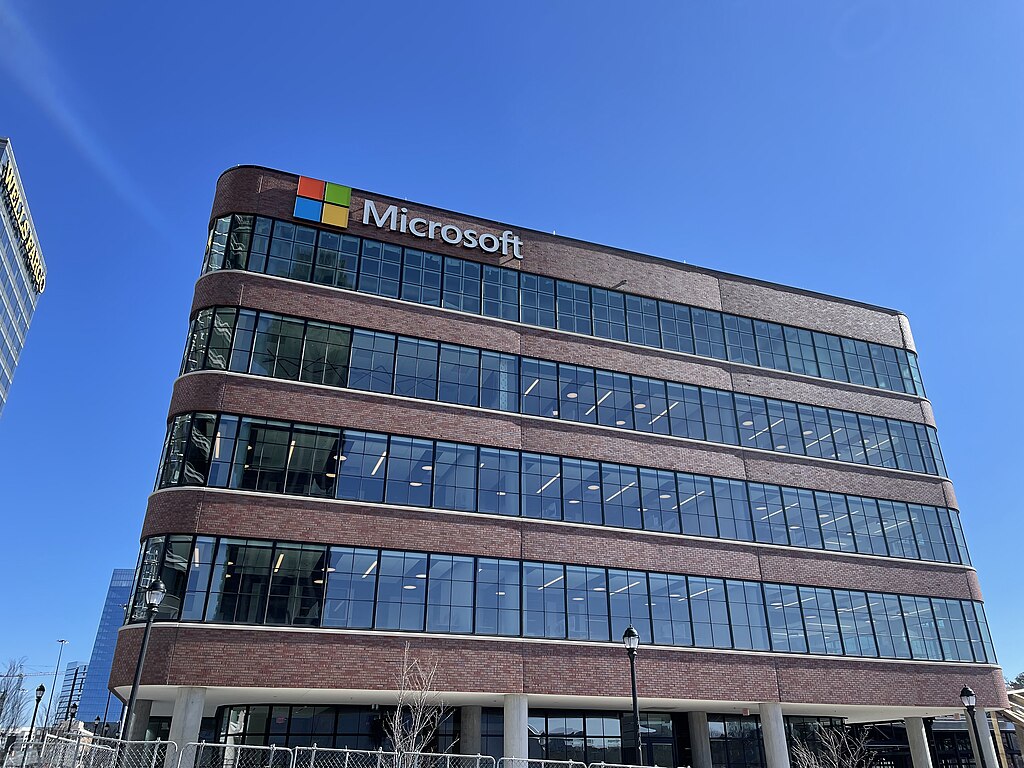
2000: The Dot-Com Bubble
The late 90s was the heyday of the tech startup. Excitement about the potential of the internet along with low interest rates caused the NASDAQ index to grow 800% between 1995–2000. The NASDAQ peaked on March 10, 2000. It was then the crash began—by October 2002, it had lost 78% of its value. What went wrong?
 Foreign and Commonwealth Office, OGL v1.0, Wikimedia Commons
2000: Wildly Misplaced Optimism
While expectations were high for a tech revolution, very few of the new startups generated much money. A sharp uptick in interest rates, news of a recession in Japan, and the Microsoft antitrust trial all contributed to the downturn. A wave of bankruptcies took place, but those tech companies that survived the Dot-Com crash, such as Amazon, Google, eBay, etc, have joined the Fortune 500.
 Tyler Lahti, CC BY-SA 4.0, Wikimedia Commons
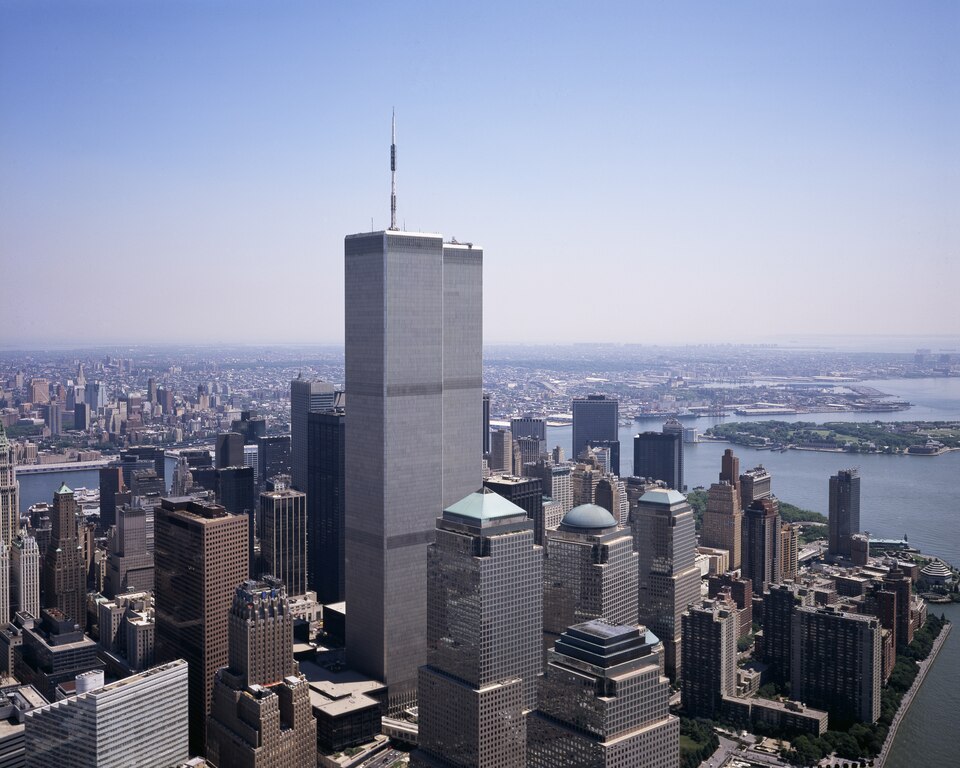
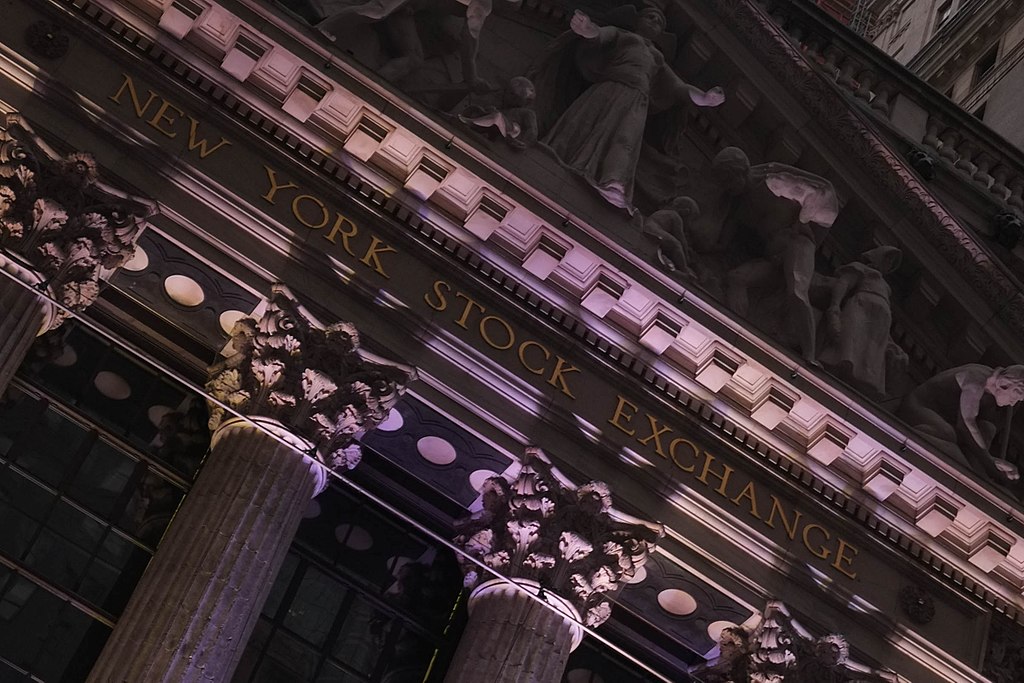
2001: The 9/11 Drop
The New York Stock Exchange didn’t open on Sept 11, 2001, and remained closed until the following Monday. That day saw the Dow drop over 7%, the biggest drop in its history. By the end of that week, the market had fallen more than 14%, another record. Though the markets rebounded by early 2002, the events of 9/11 showed the system was vulnerable.
 Carol M. Highsmith, Wikimedia Commons
2001: A Black Swan Event
The fall of the Twin Towers and subsequent recovery effort caused significant disruption of operations at the New York Stock Exchange. In part because most trading has become electronic since 2001. Though the physical threat is mostly gone, cyberattacks are now an ongoing potential source of stock market crashes.
 Yiyuanju, CC BY-SA 4.0, Wikimedia Commons
The 2008 Financial Crisis
The bankruptcy of the Lehman Brothers investment bank on September 15, 2008 was the signature event of the 2008 Financial Crisis. It caused a crash of the Dow Jones average of more than 4%, the biggest one-day drop since 9/11. The index went down 54% between October 2007 and March 2009 before it began to slowly recover.
 David Shankbone, CC BY-SA 3.0, Wikimedia Commons
The 2008 Financial Crisis: Climbing Out Of The Hole
A massive wave of US government bailouts helped to keep the economy afloat through 2008–2009. This also kept the stock market from completely imploding. The Dow Jones average languished for a few years but finally regained its pre-2008 level in 2013.
 Robert Scoble, CC BY 2.0, Wikimedia Commons
2010: Flash Crash
The word “volatility" took on a whole new meaning on May 6, 2010 as the Dow lost 1,000 points and 9% of its value in half an hour. Though the index bounced back by 600 points the same day, several S & P 500 companies had seen their share price briefly drop to penny stock status. What caused the so-called Flash Crash?
 Carol M. Highsmith, Wikimedia Commons
2010: Not A One-Time Event
Investigations into the Flash Crash settled on a number of causes, most importantly the actions of high-frequency traders. These algorithm-driven trading companies quickly buy and sell large blocks of shares on a millisecond scale, fuelling volatility. While some have called for a tightening of regulations on algorithm trading, two further flash crashes occurred in 2015.
 Paul Sableman, CC BY 2.0, Wikimedia Commons
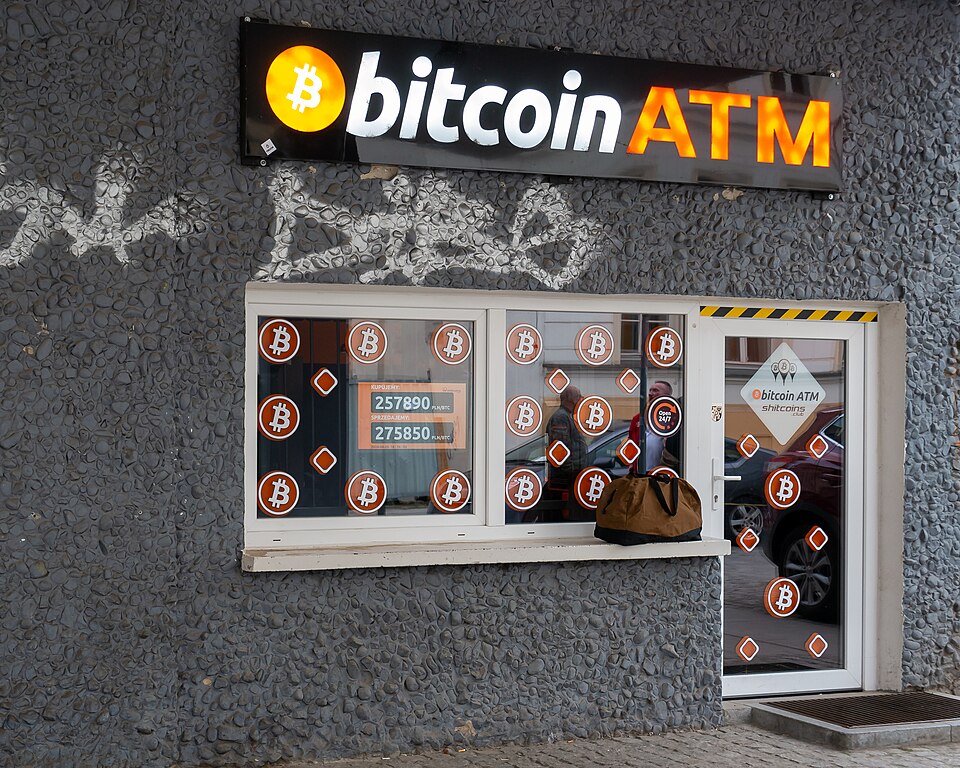
2018: Crypto Crash
Speculation in cryptocurrencies, especially Bitcoin, led to this spectacular crash starting December 2017 and lasting through the following year. In that time, cryptocurrencies lost 80% of their value. The S & P 500 was down 20% in December 2018 from its 52-week high. But the cryptocurrency story was far from over.
 Sebastiaan ter Burg, CC BY 2.0, Wikimedia Commons
Since 2018: More Crypto Bubbles
The cryptocurrency industry has seen more bubbles and crashes in the years since 2018, including crashes of Bitcoin in 2021–2022. TerraUSD and their Luna cryptocurrency also collapsed in 2022, wiping out $60 billion in value in a week.
 Matti Blume, CC BY-SA, Wikimedia Commons
2020: Covid Crash
The S & P 500 dropped 30% of its value between February 19 and March 23 due to worries about the emergence of the coronavirus. Similar losses were seen all over the world. It would take until the end of the year for the markets to resume their climb as governments implemented emergency stimulus programs. Unfortunately, another crash was just around the corner.
 Frankie Fouganthin, CC BY-SA 4.0, Wikimedia Commons
2022: Aftershock
This post-Covid crash saw a 19% one-year drop in the S & P 500 and a 33% tumble on the NASDAQ. Other markets did poorly through the year as armed conflict, cryptocurrency bubbles, supply chain disruptions, and inflation contributed to fears of a recession. While inflation has largely subsided since then, the markets have also hit new highs in 2023–24.
 Scott Beale, CC BY-SA 4.0, Wikimedia Commons
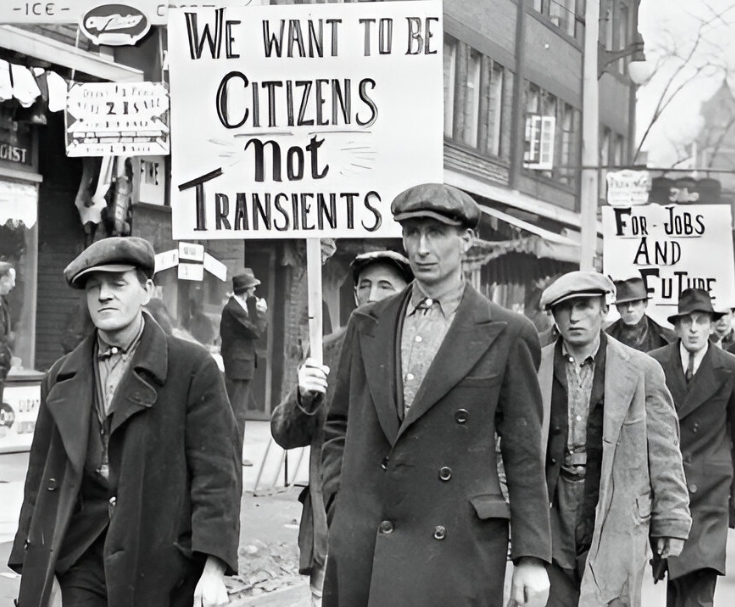
1929: The Big One
An overpriced stock market and irrational optimism combined with a stagnating economy to bring about the October 1929 Wall Street crash, the biggest of them all. Black Thursday was followed by Black Monday and Black Tuesday, wiping out a quarter of the market’s value. An enormous percentage of investors had bought their shares on margin, compounding the wipeout. The Great Depression was off and running.
1929: Big Problems And Big Solutions
The 1929 Wall Street Crash was a terrible day for all of America, but there were rumors that some stockbrokers, in their desperation and despair, had jumped to their deaths from their office skyscrapers. Luckily, these rumors turned out to be completely false. According to author John Kenneth Galbraith and his 1955 book The Great Crash, 1929, the rumors were mainly a result of erroneous British newspaper reports.
The stock market crash and depression led to the election of Franklin Roosevelt. His administration brought in far-reaching reforms and public programs. The Securities and Exchange Commission (SEC) was formed to enforce regulations and transparency for publicly-traded companies. The government also passed the Glass-Steagall Act to regulate banking and investing.
 National Archives Photo, Wikimedia Commons
Timing The Next Crash
Governments, banks, and regulators have gotten very good at heading off and mitigating market crashes. We haven’t seen a repeat of the 1929 meltdown or the chaotic 1800s in the United States. Despite this, our list shows that stock market crashes are still a frequent occurrence, driven by world events, new technologies, and the ever-present human factor.
You May Also Like:
When Did The Stock Market Crash?
Not A Gamble: Basics To Know About The Stock Market
 The Central Intelligence Agency, Wikimedia Commons
Sources: 1, 2, 3, 4, 5, 6, 7, 8, 9, 10, 11, 12, 13, 14, 15, 16, 17, 18, 19, 20, 21, 22, 23, 24, 25, 26, 27, 28, 29, 30, 31, 32, 33, 34, 35


_tulipomania,_Hendrik_Gerritsz_Pot_c1637.jpg)
.jpg)
.jpg)
_LCCN2002723398.jpg)
.jpg)
.jpg)
.jpg)
_(6718424839).jpg)
.jpg)
.jpg)
.jpg)